A Boring JVM Memory Profiling Story
JavaJVMMemory LeakScalaJProfilerProfilingBackground of Memory Leaks
I encountered another memory leak problem recently. I’ve debugged a few of memory leak problems in the past, including the one in Splice Machine, an open source distributed SQL engine based on HBase but was sadly discontinued. The memory leak problems are interesting because it’s challenging to find the root cause. However, I’ve never written a blog about it. Memory leak problems are not so usual, so when I encountered a new one, I kind of need to remember what tools I’ve used. So this time, even though not as interesting as some other memory leak problems I’ve debugged in the past, I decide to write it down as a note for my own reference in the future. The tool set I used this time is relatively simple. I guess I can write more when I use others in the future. This is more like a dev log instead of a tutorial. The “boring” in the title means it’s a pretty standard process and the problem is not that hard to find this time.
Most of the memory leak bugs are very easy to fix once the root cause is found, but finding the root cause is tricky. First of all, it’s hard to reproduce: sometimes it only happens in production environments. Without knowing the cause, it’s hard to reproduce locally. Even if it can be reproduced consistently, it may take some time to let the memory accumulate so the debugging loop can be time-consuming sometimes. Last of all, unlike some other bugs that you have an exception and a nice stack trace to help you identify which code causes the problem, it’s almost impossible to find the root cause without the help of a profiler, which itself has challenging parts depending on the platform.
Luckily, JVM has good profilers. That’s one of the reasons Scala, a JVM based language, is my favorite language. (The criteria of a good production language for me is not only the language itself, but also the ecosystem like library, IDE and profilers. JVM based language makes lots of the criteria easy to meet.) This time I used a very popular profiler JProfiler. Other popular choices that I have used are VisualVM and Java Mission Control. But I found JProfiler is both powerful and easy to use. The only downside is you need to buy a license. It has a free trial and open source license. So if you have an open source project or just need to use it for a few days, you can still use it for free.
The Problem
Okay, enough of the background. Let’s dive into the memory leak problem I encountered this time. As mentioned in the previous blog Migrate Scala2grpc to Cats Effect 3, I migrated one of my side projects to Cats Effect 3 as well, with a lot of other dependencies. This side project is RSS Brain. There are two parts on the backend: one for serving client requests with gRPC and gRPC web, another one for fetching RSS feeds. The fetcher gets the RSS feeds that haven’t been fetched for a while from the database with the help of doobie and quill, and fetches them in parallel with the help of fs2 stream and Cats Effect.
After the mass upgrades, I looked into the metrics to make sure everything is okay. Then I found the fetcher’s memory starts to increase slowly. Looks like a memory leak problem to me. Here is the memory usage graph:
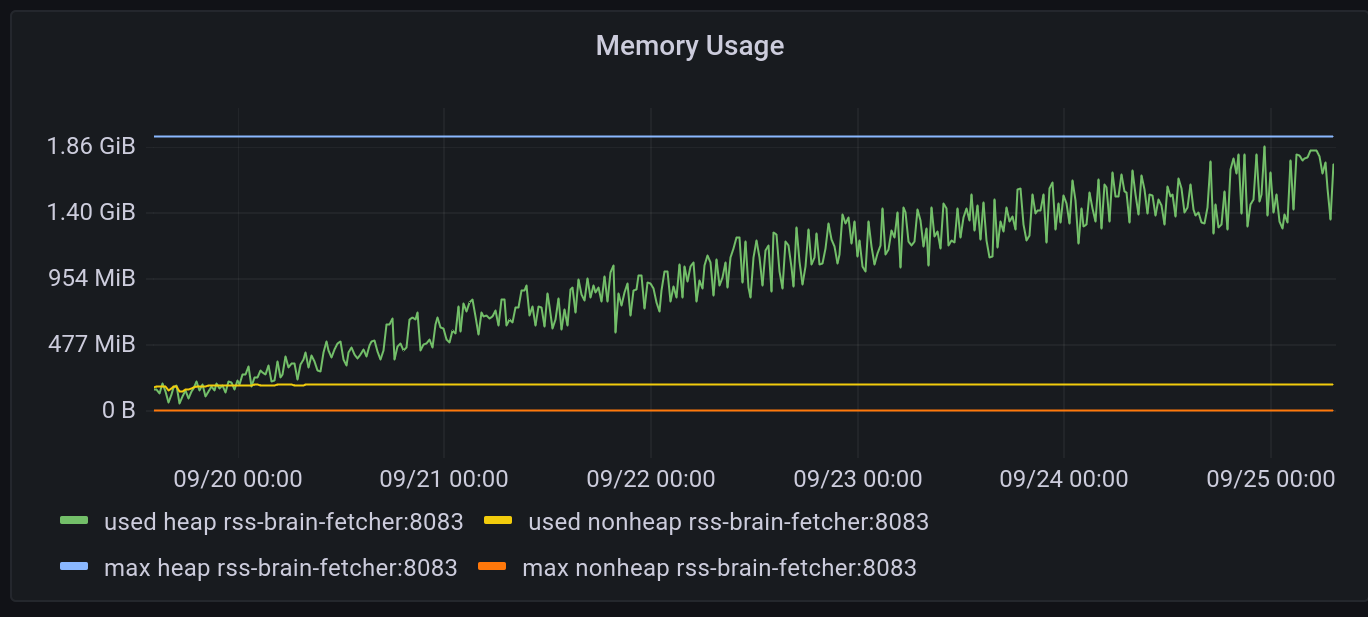
It seems the JVM would eventually run out of memory but I didn’t wait for it. It’s good to try if forcing a full GC will reclaim the memory or not. In my case, full GC doesn’t help much.
Another metrics to look at is the GC metrics. Only after I shipped the fix, I realized the GC didn’t look normal when there was this memory problem:
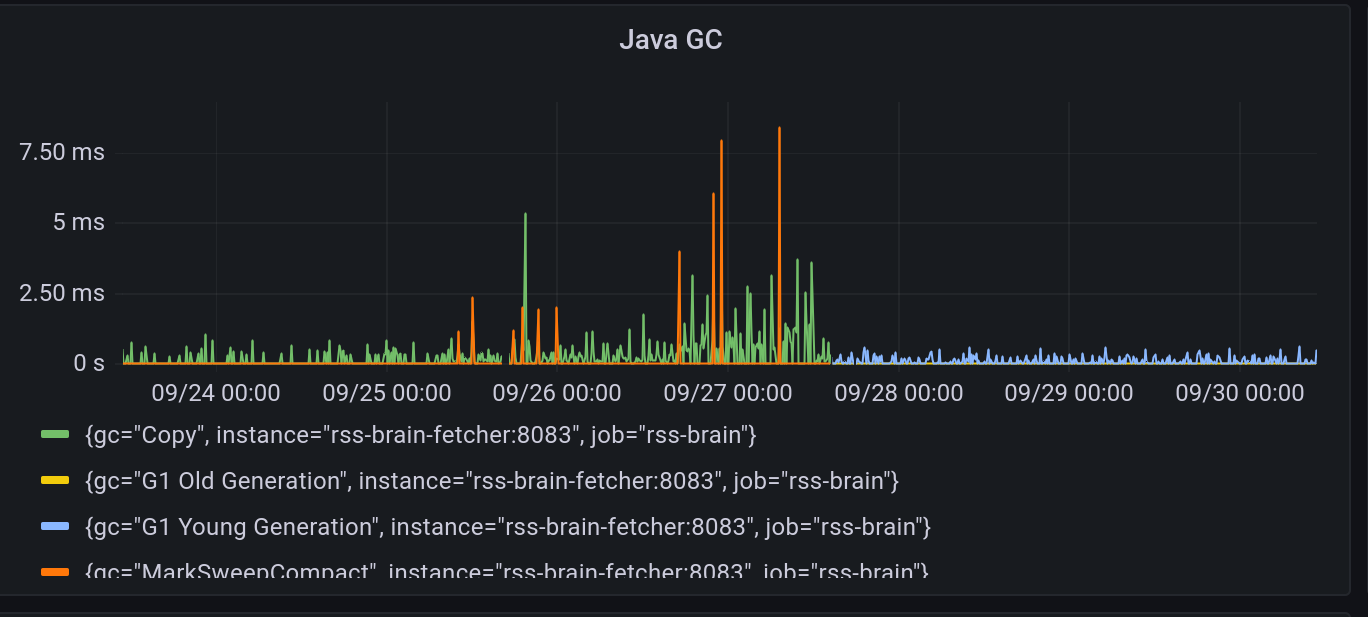
Before the blue line starts, GCs are all “Copy” and “MarkSweepCompact”, which means the memory is mostly being moved around instead of reclaimed. After the blue line starts, which was when the fix was shipped, we start to see normal young and old generation GC.
So these metrics indicate that we may have a memory leak issue. Let’s start to debug it.
Setup Profiler
In this case I’m using JProfiler. But as I mentioned above, VisualVM or Java Mission Control should also be able to do the job.
JProfiler has a nice wizard to let you setup the profiler. In my case, since I run the service in Kubernetes, I need to select remote server profiling and go through the wizard. We are going to use kubectl to forward the debugging port to local, so that we can just use localhost:8849 as the remote address. At the end of the setup wizard, it will prompt you to download the profiler agent and include it with a Java command line argument. Since the service is running in container, I added the following lines to the Dockerfile in order to include the agent in it:
RUN apt update -y && apt install -y wget
RUN cd /opt && \
        wget -c 'https://download.ej-technologies.com/jprofiler/jprofiler_agent_linux-x86_14_0.tar.gz' && \
        tar -xf jprofiler_agent_linux-x86_14_0.tar.gz
Also add this flag to Java command line when starting the service:
-agentpath:/opt/jprofiler14/bin/linux-x64/libjprofilerti.so=port=8849,nowait
After the new container is deployed, we can port forward 8849 from the service to our localhost with kubectl:
kubectl port-forward <service-pod-name> 8849:8849
Memory Comparison
Since it’s a memory leak problem, we want to find out what objects are increasing. First let’s restart the JVM, connect JProfiler to it and take a snapshot of all objects in live memory:
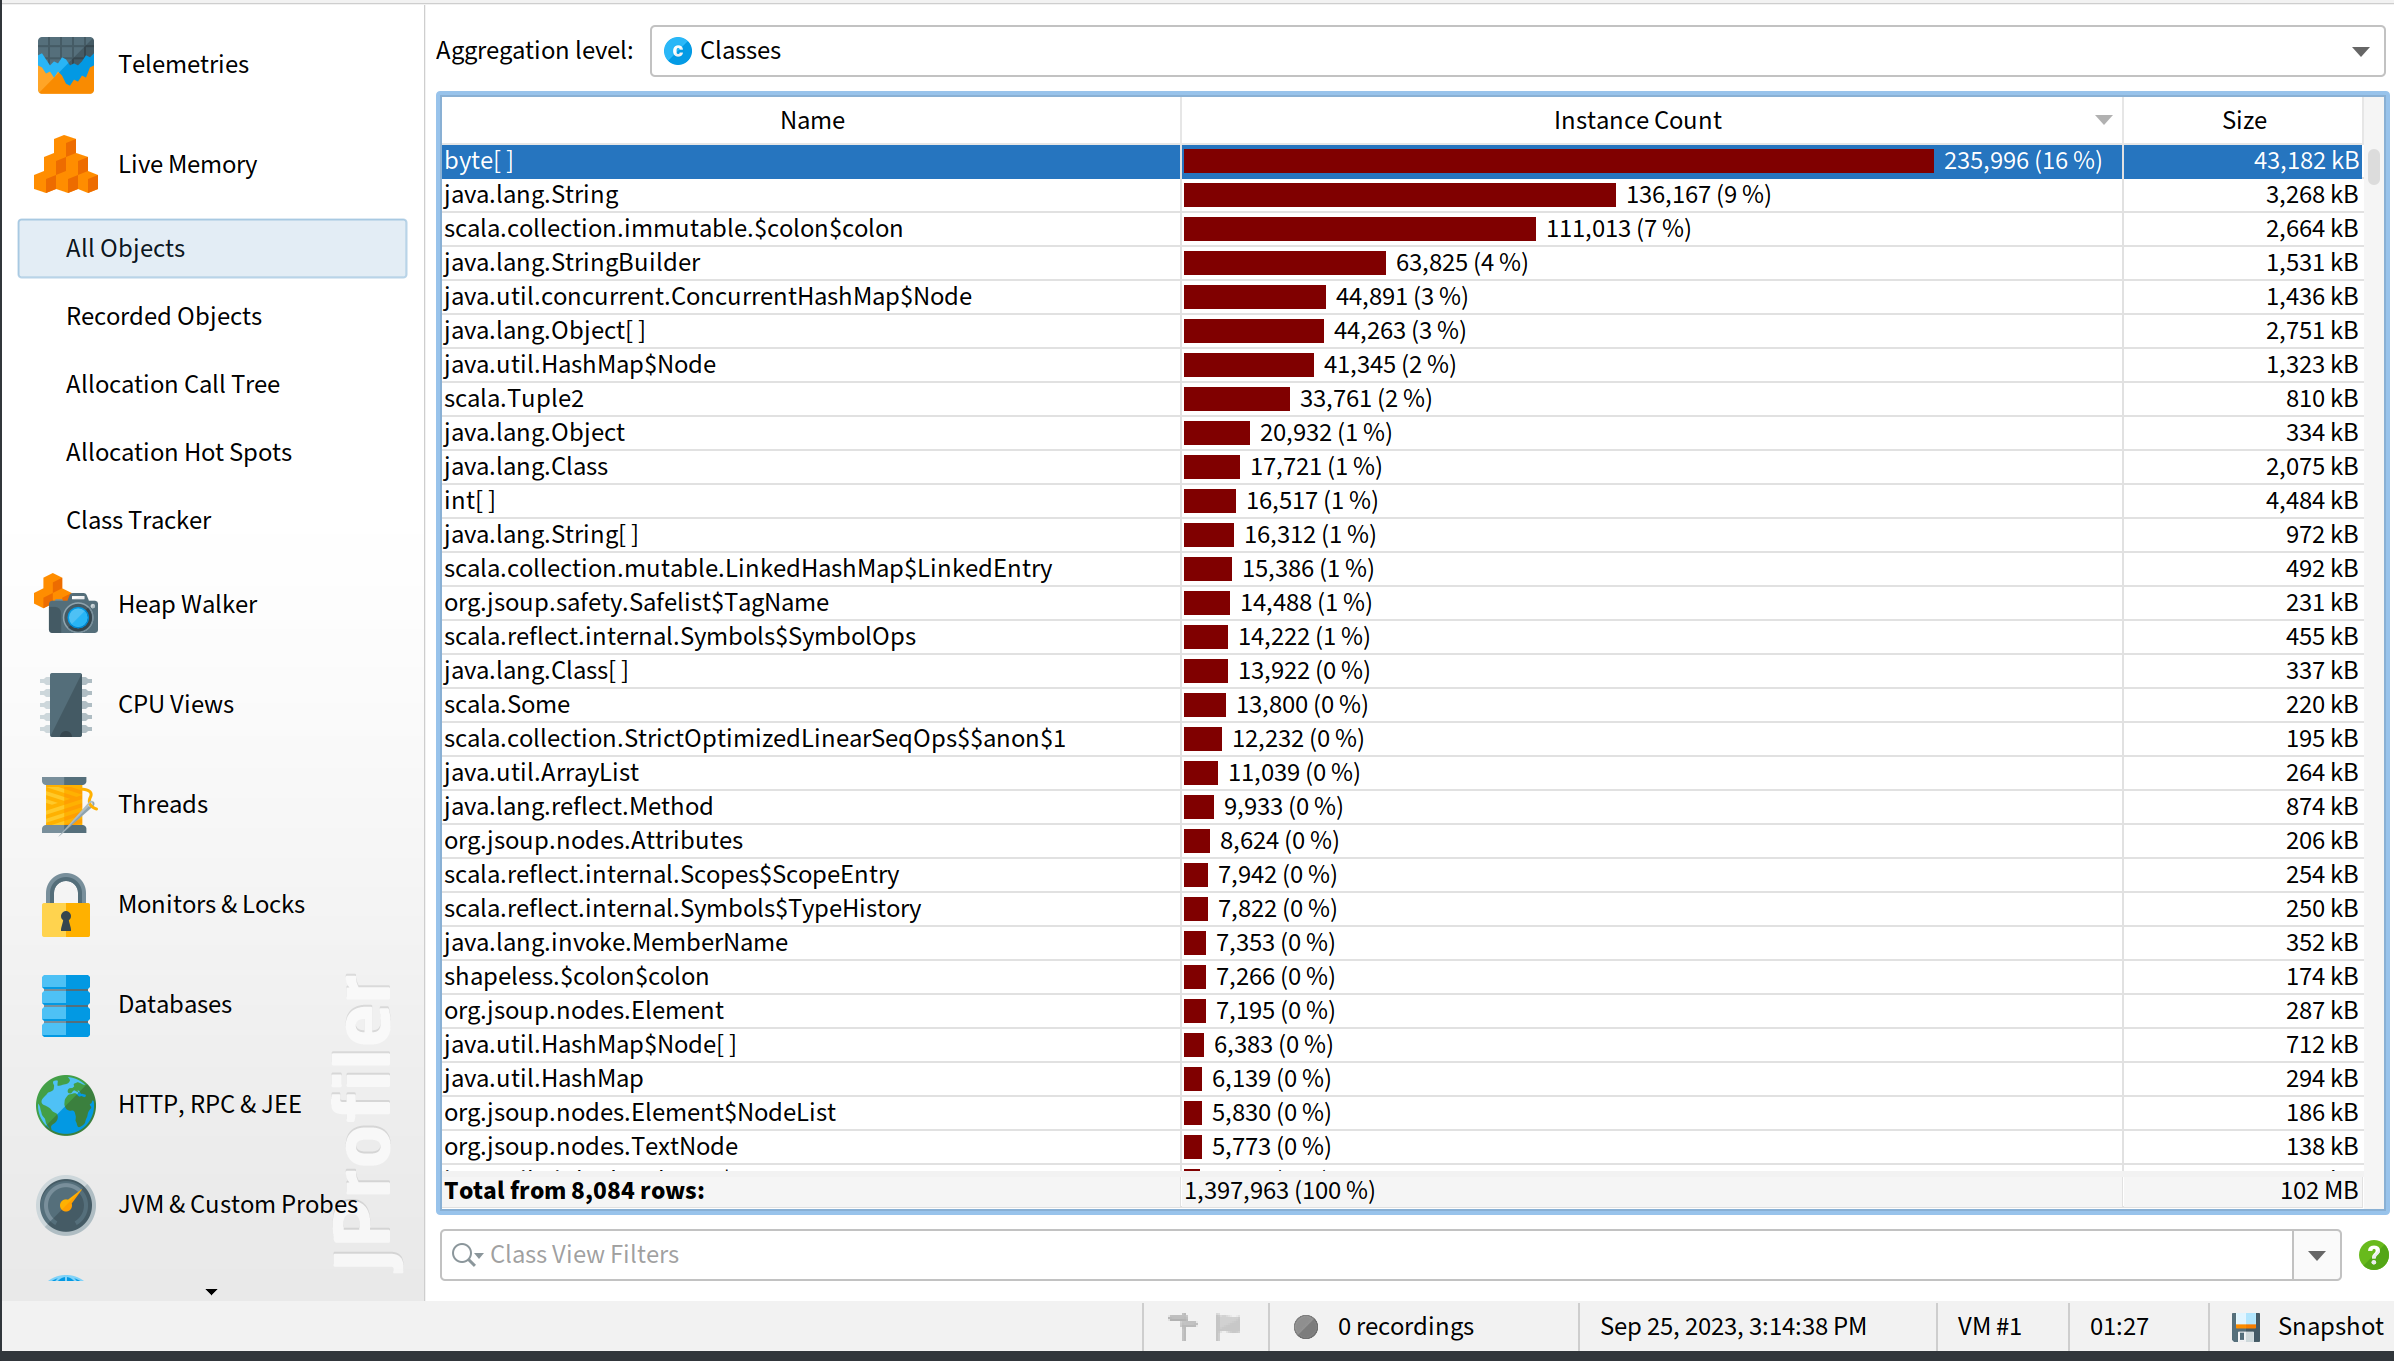
We can see byte[] takes the most memory but it doesn’t mean it’s responsible for memory leak, since we need to look at the increase of the memory.
So we need to wait for a while for the memory problem starts to happen. In my case, obvious memory increase can occur after the JVM runs for about 12 hours. Normally if this is a work related thing, I may want to make it faster by increasing the work load. In this case, the code is fetching RSS feeds, so I could make the interval shorter so that it makes more requests. But since this is only a side project, I don’t need to continue working on it, and I also don’t quite like the idea to increase the requests to target RSS websites to increase their load. So I decided to just let the JVM run during the night and take another look the next day:
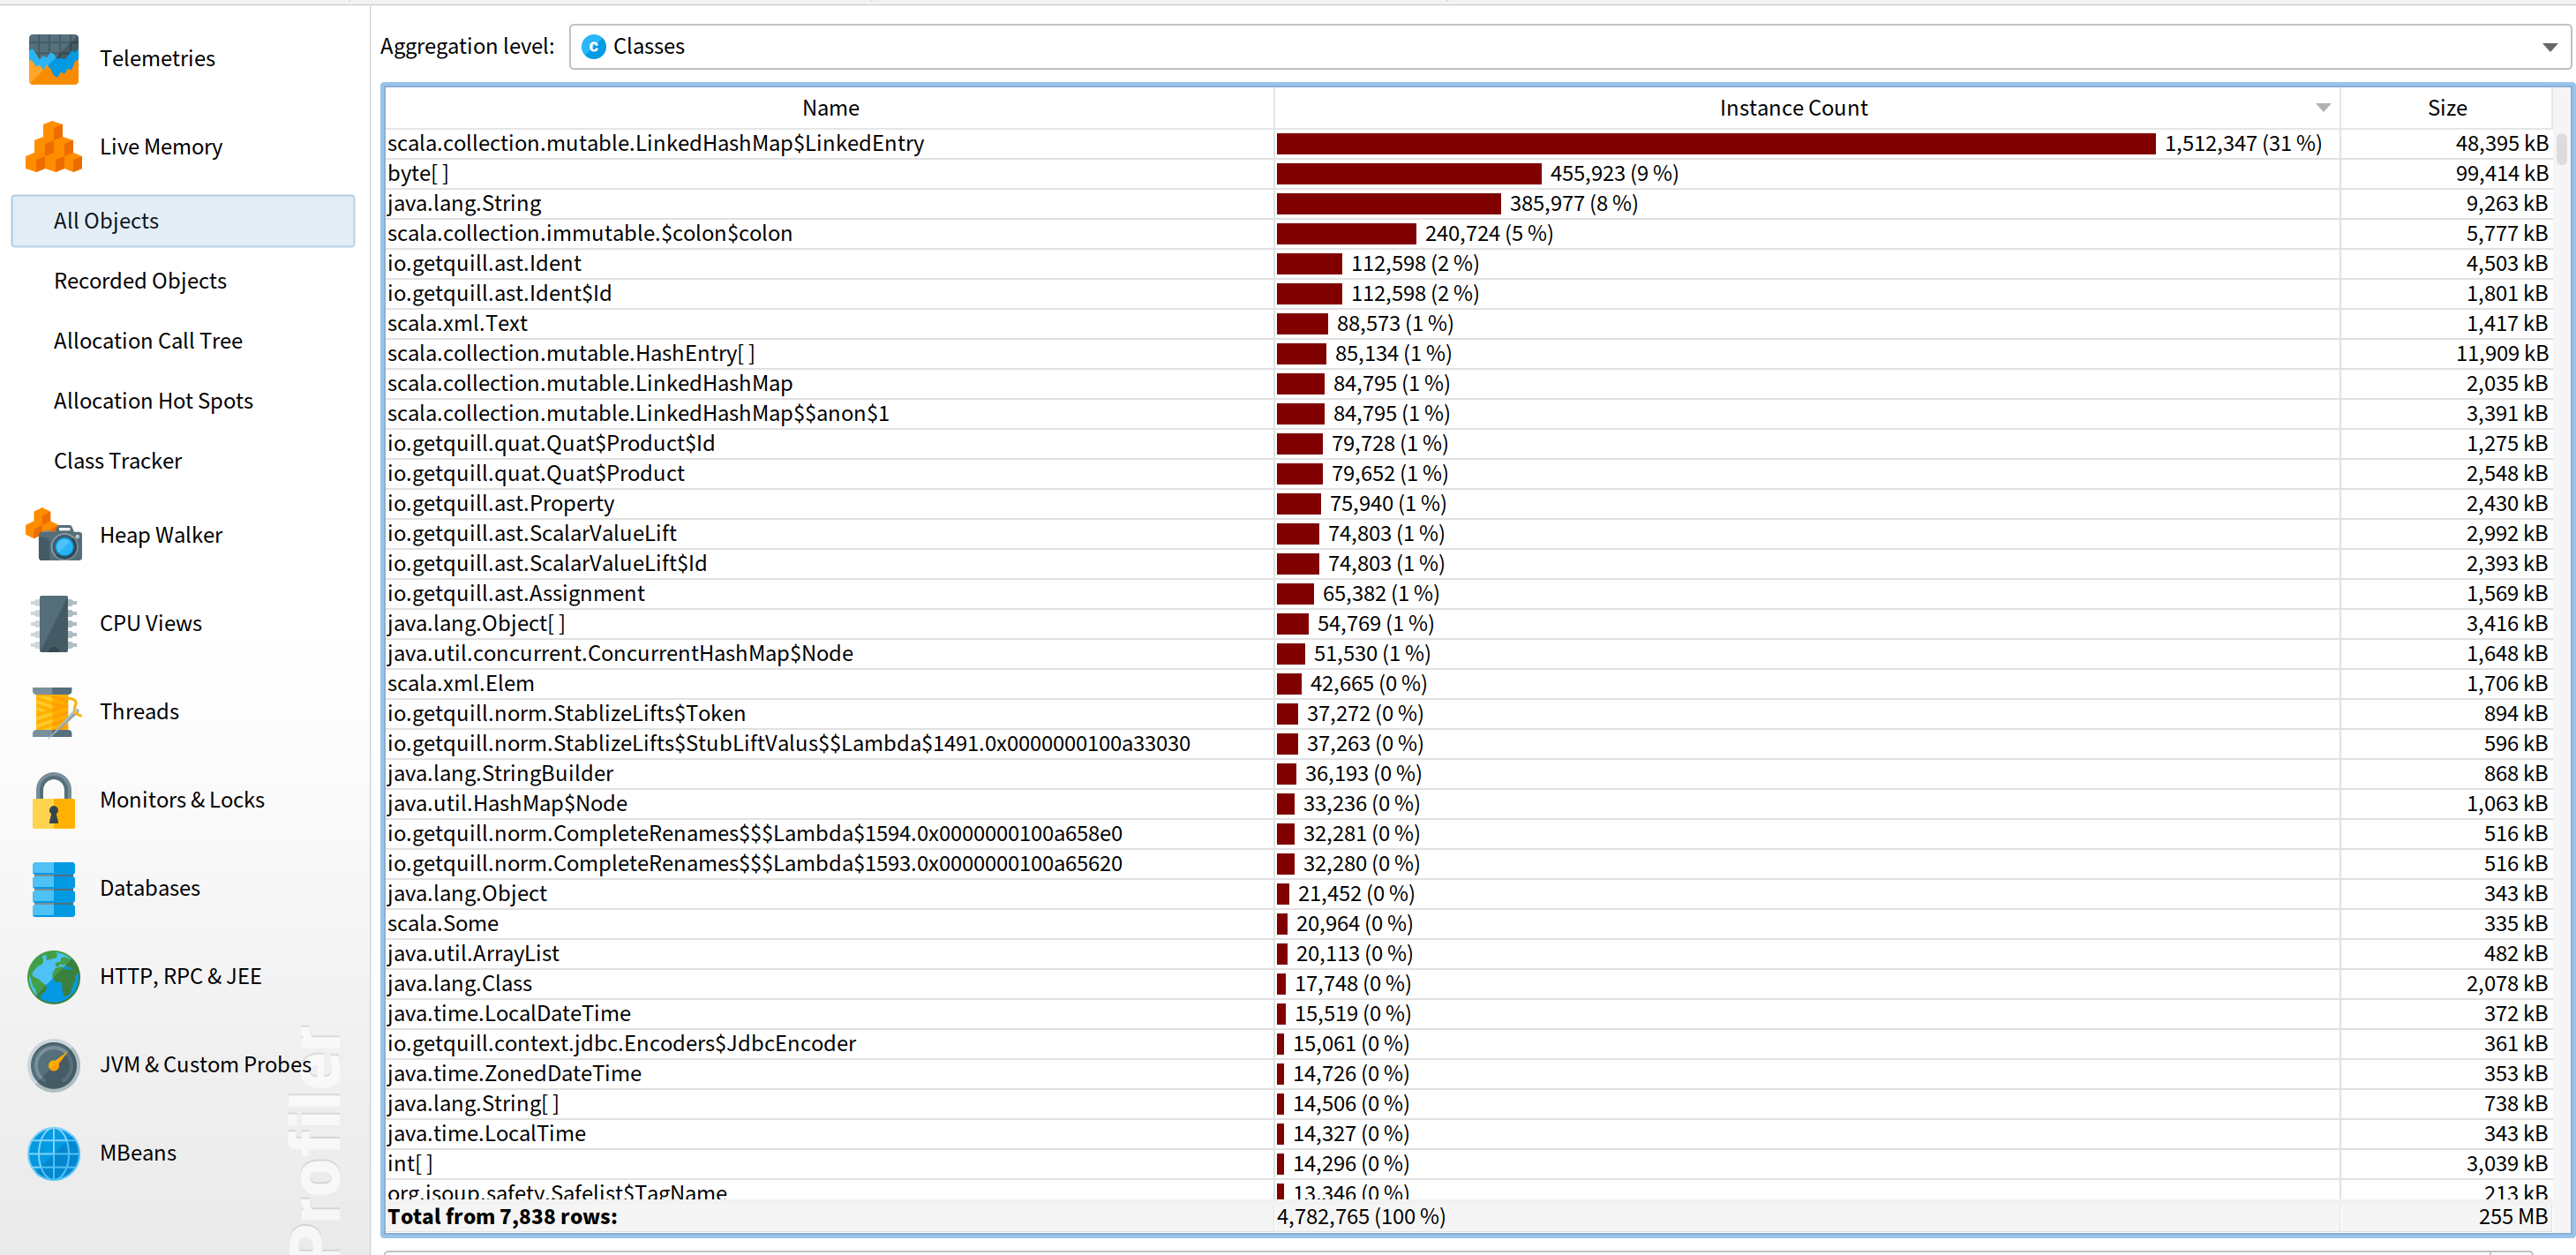
Okay, obviously scala.collection.mutable.LinkedHashMap$LinkedEntry increased a lot. But is there anything else? Conveniently, JProfiler has the feature to compare 2 snapshots. Just go to “Session” -> “Start Center” -> “Open Snapshots” -> “Compare Multiple Snapshots”. After open those 2 snapshots, select both of them on the left and then compare memory:
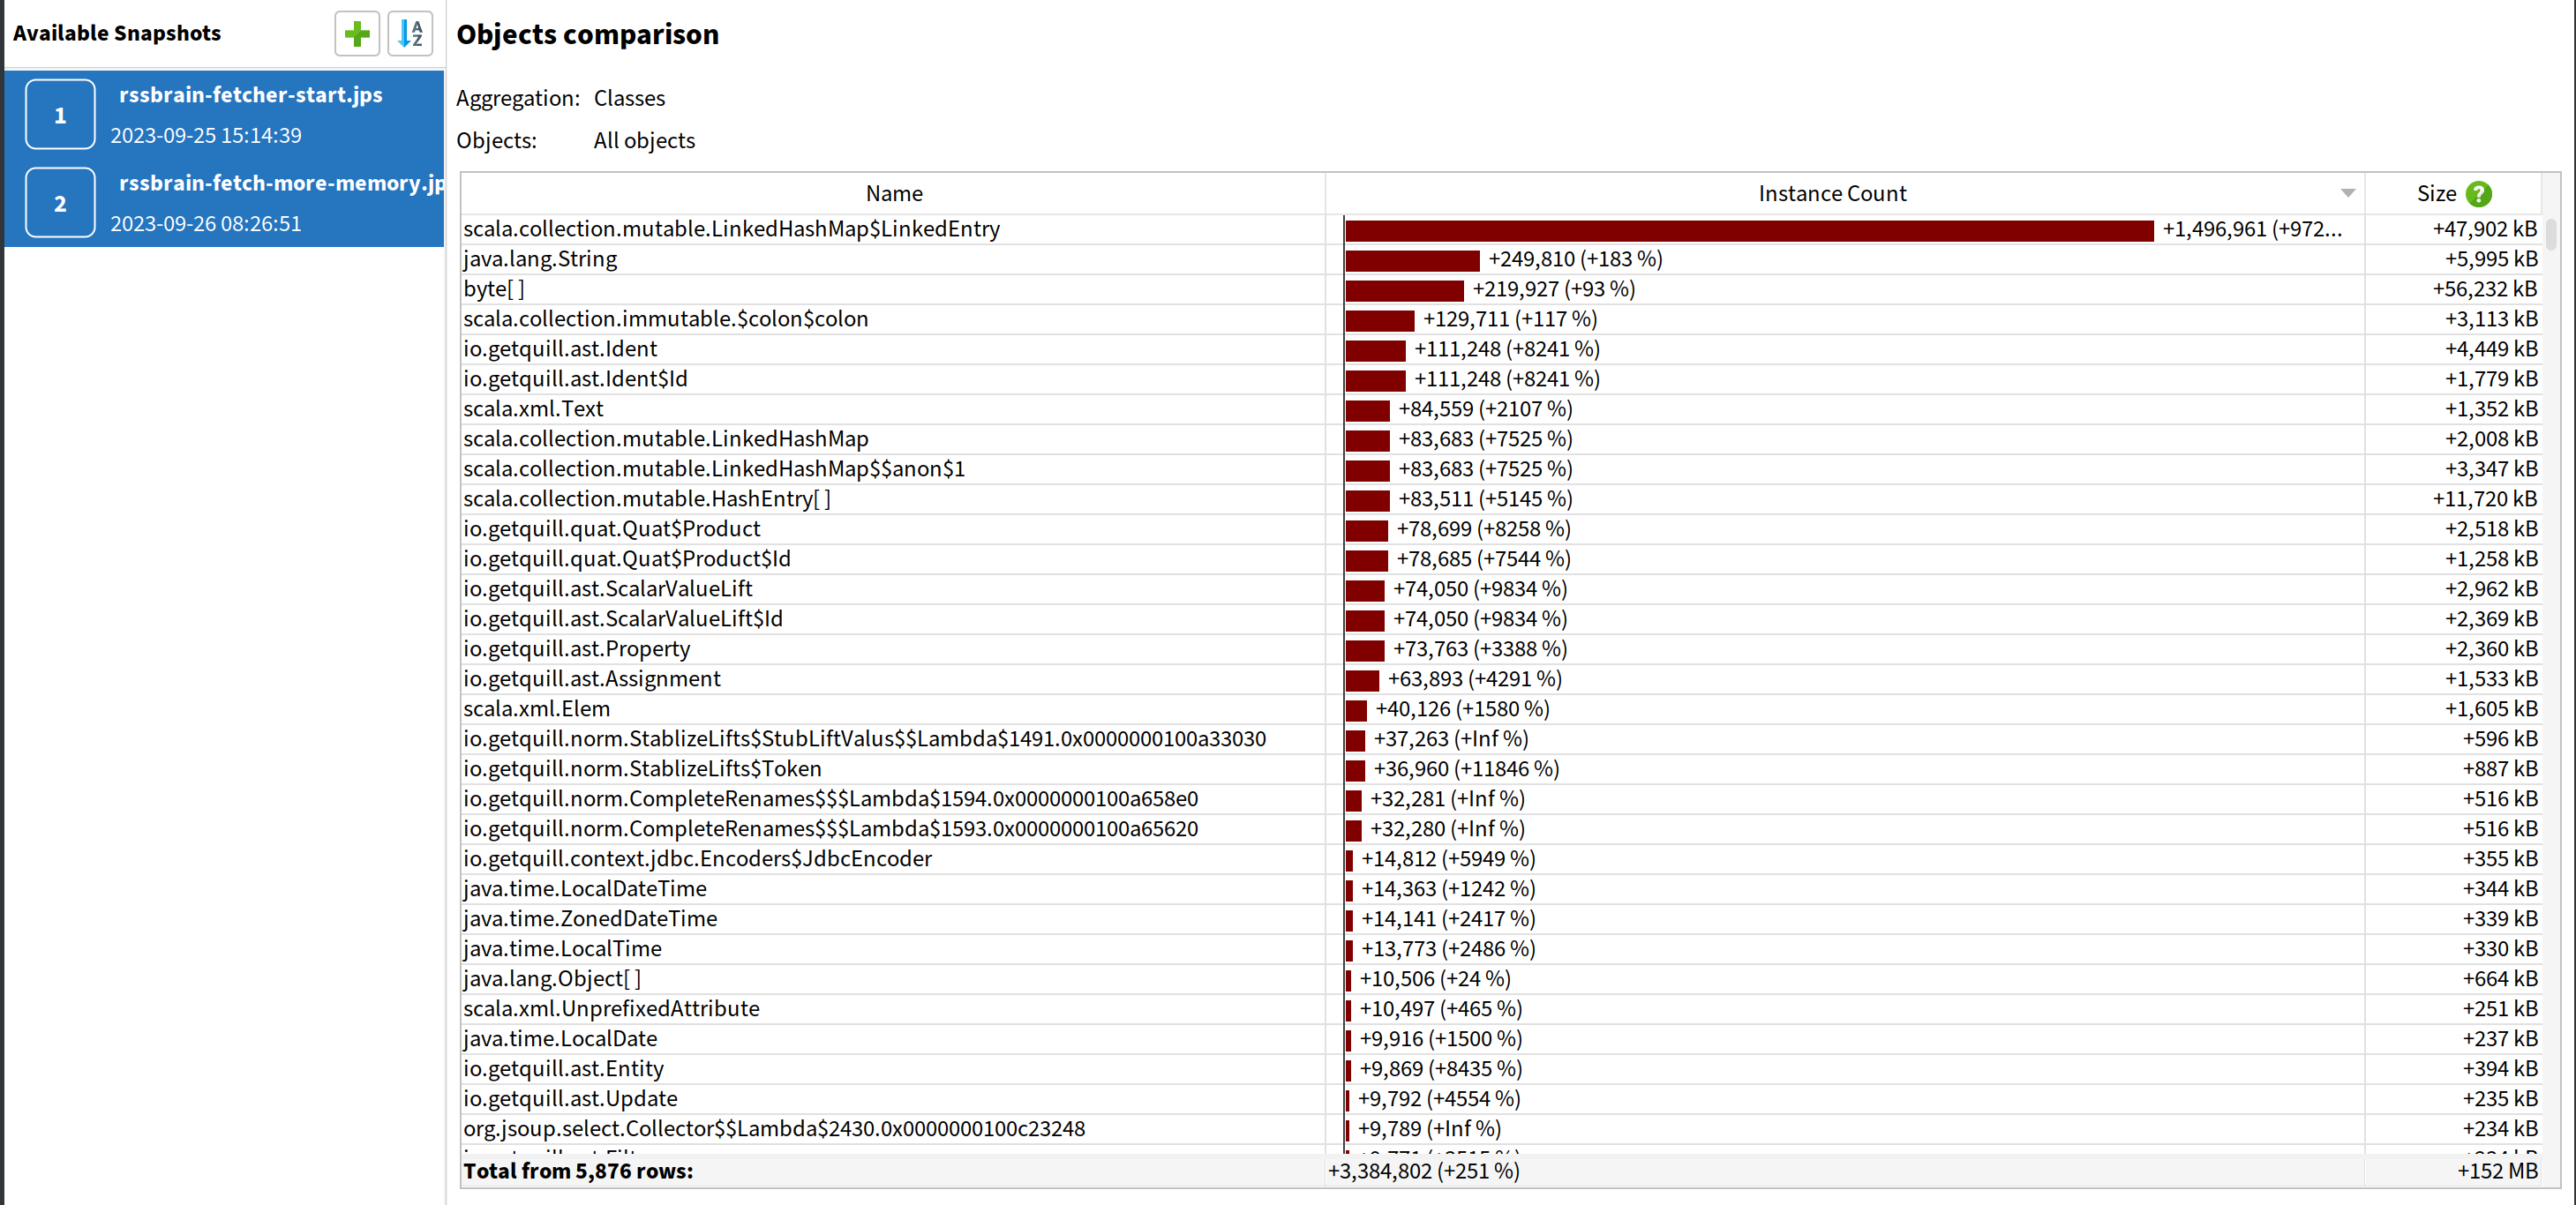
We can see LinkedEntry indeed increased the most by instance count. However, if we sort by size, we will find byte[] increased the most by memory size.
A False Root Cause
Since byte[] increased the most by memory size, I’d like to start there. By using “Allocation Call Tree”, we can check which code allocates byte[] the most. After profiling for a while, we get the following result:
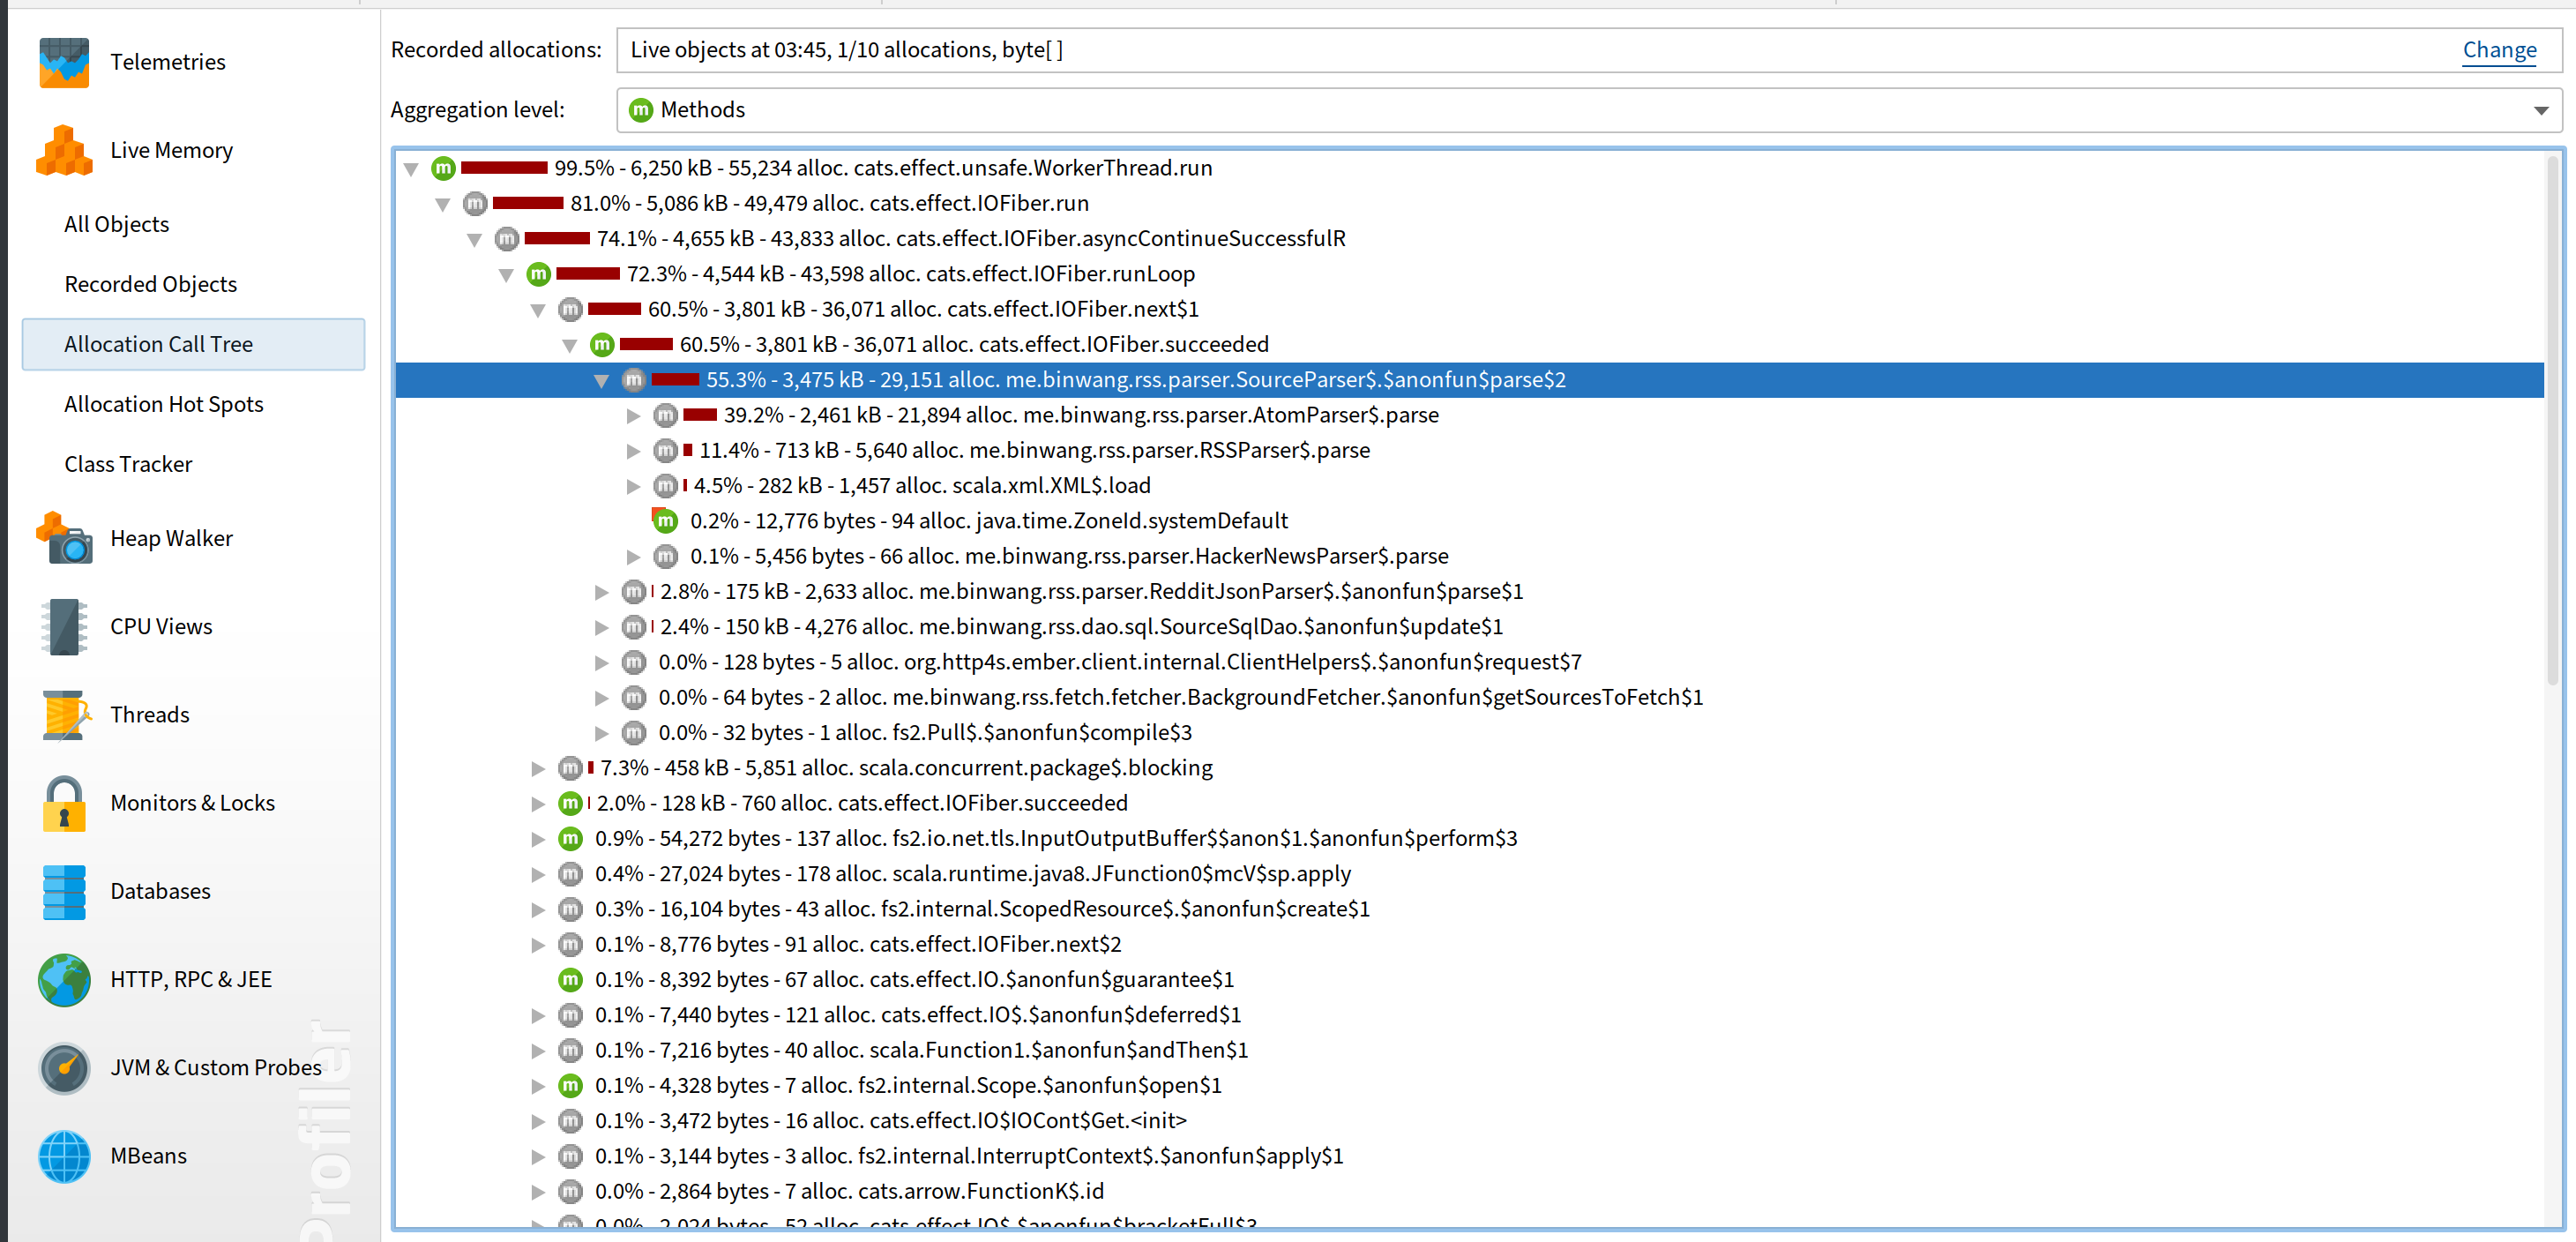
Okay, the top allocation goes to my own code me.binwang.rss.parser.SourceParser. It’s the class that parses the XML from RSS feeds. So I looked into it if it has any code that can cause memory leak and I found this:
object SourceParser {

  def parse(url: String, content: Resource[IO, InputStream]): IO[(Source, Seq[Try[FullArticle]])] = {
    content.use { c =>
      // ...
      throw new RuntimeException(s"Error to parse source xml, unrecognized label $label")
      // ...
    }
  }
So there is an exception thrown in a Resource.use. Resource.use makes sure to clean up the resource when the use scope is over. But what will happen if it throws an exception in there? I thought it will cause use to not handle the cleanup properly. So I changed it to use IO.raiseError instead of throwing it directly.
However, while I was deploying the code, I thought I should really test it. So I wrote a piece of simple code to see whether Resource will still be cleaned up if there is any exception thrown in use, and the answer is yes. So this shouldn’t be the root cause. And the deployment result also confirms that: the memory kept increasing with this fix.
The Real Root Cause
Maybe byte[] just happened to use more memory because it’s parsing a large XML at that time. It’s okay that it isn’t the real root cause since we have another lead: scala.collection.mutable.LinkedHashMap$LinkedEntry. From the profiling, its allocation tree looks like this:
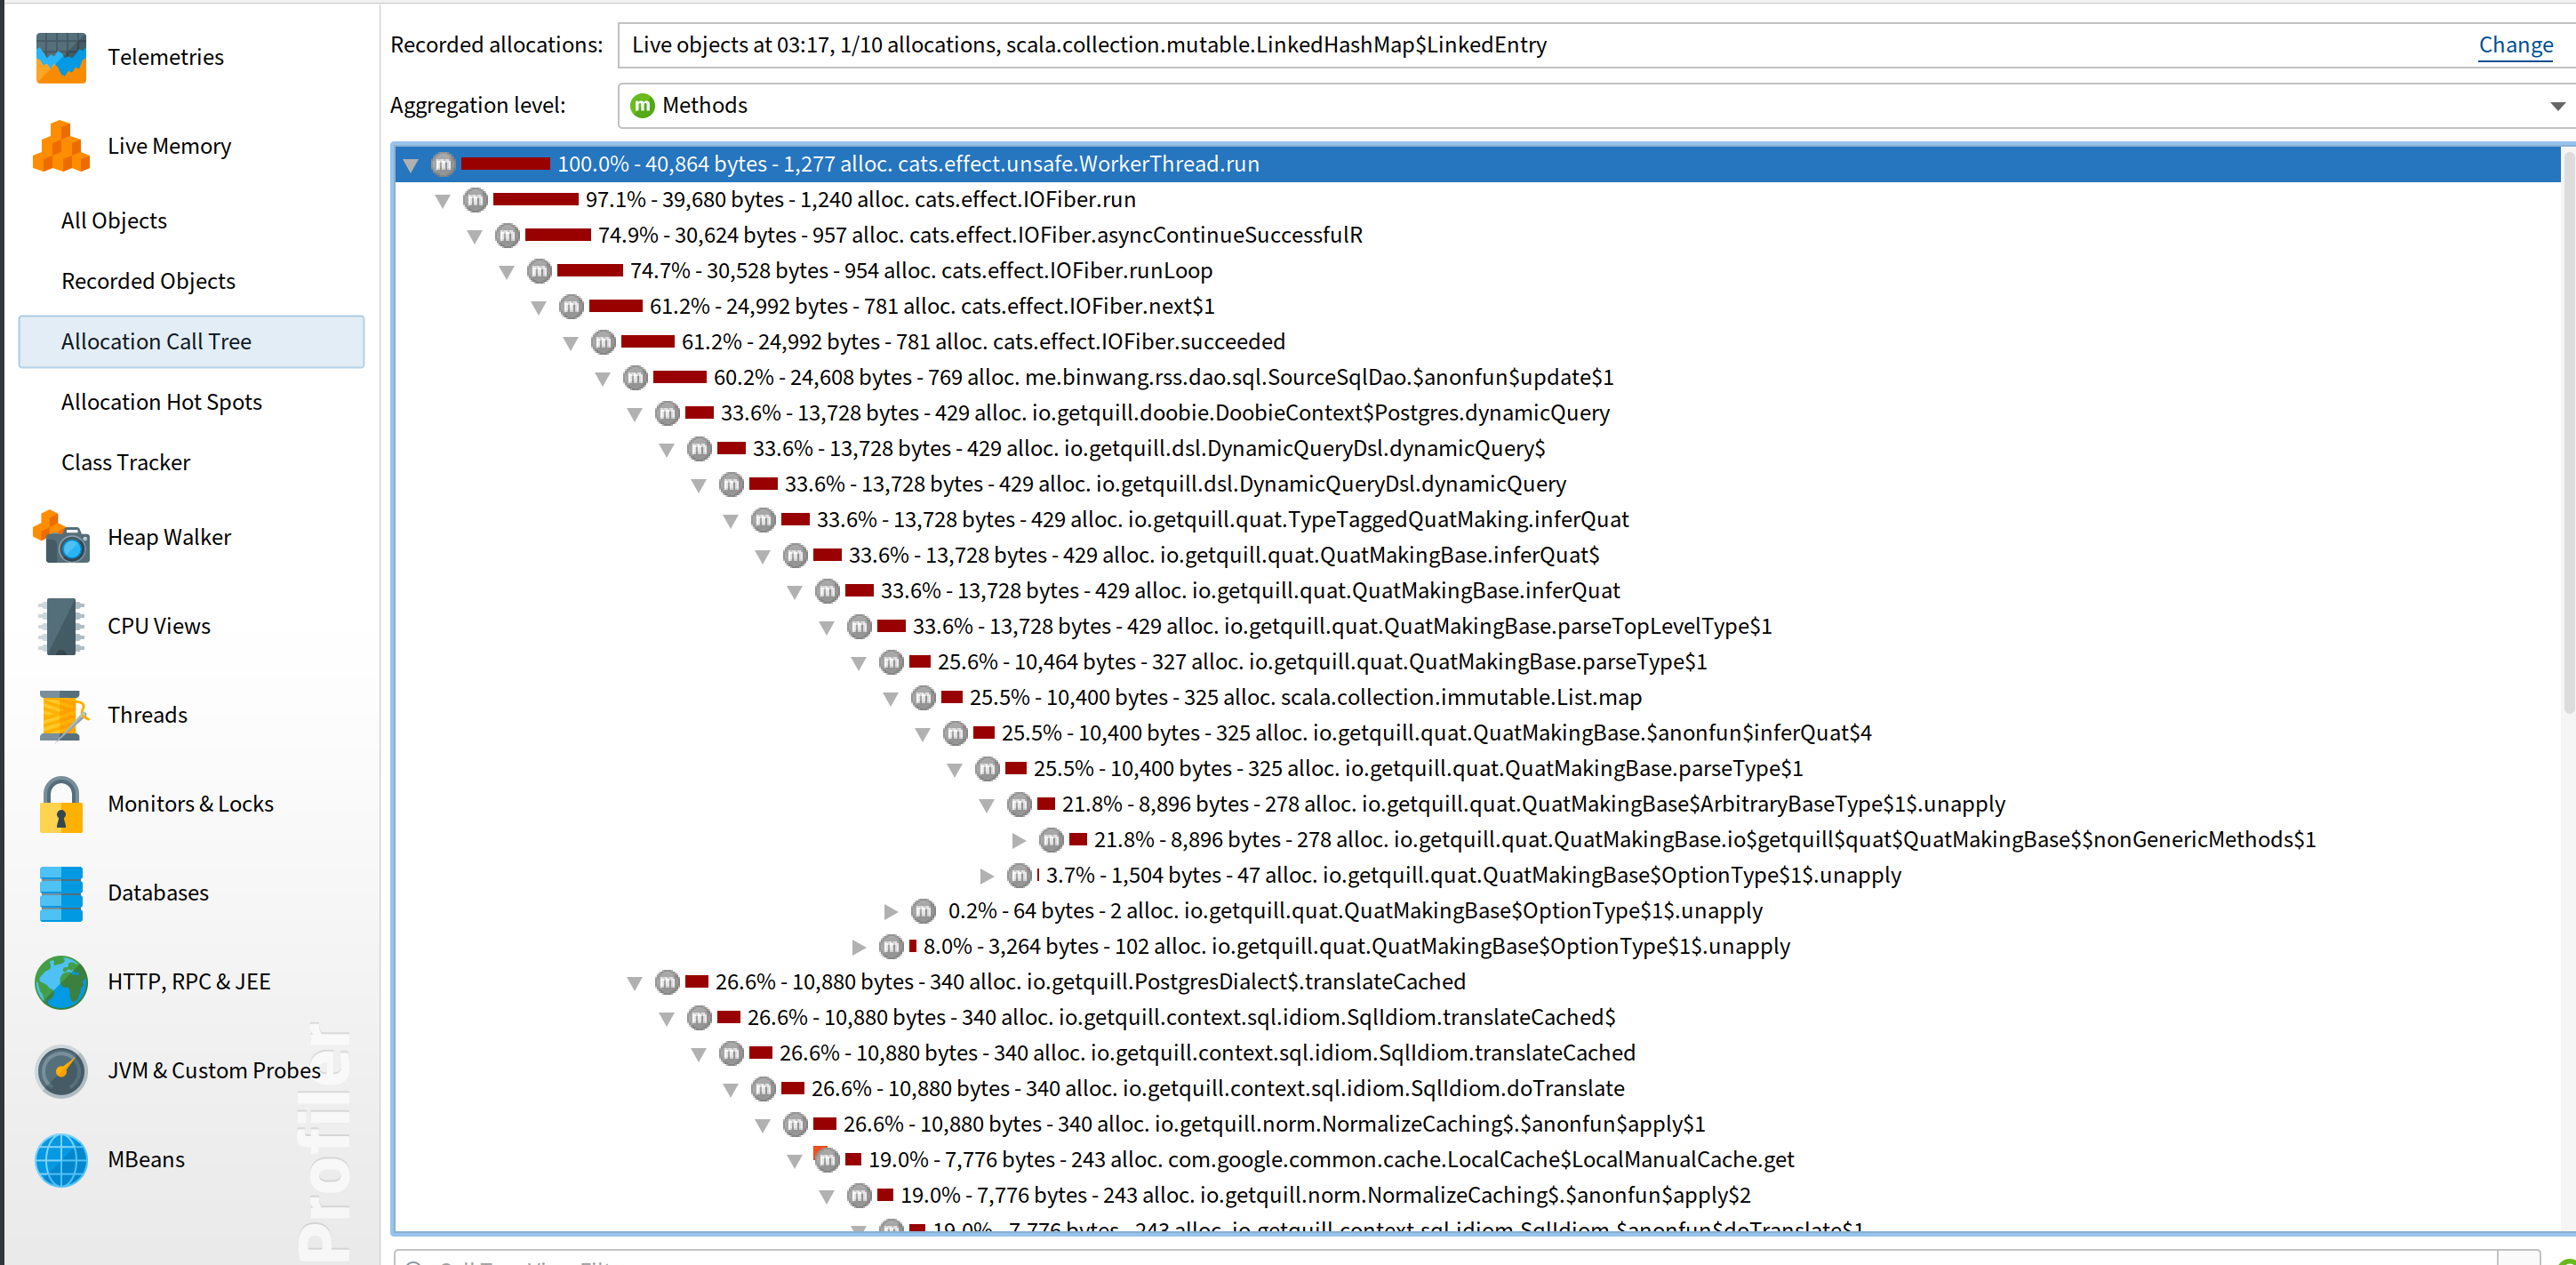
Okay, so seems most of them come from quill. Quill is a library that compiles Scala DSL to SQL queries. It is fairly complex since it uses macros. I checked the code in the allocation tree and couldn’t find out what is wrong.
Then I tried to check the object reference to see which instances are pointing to these LinkedEntry:
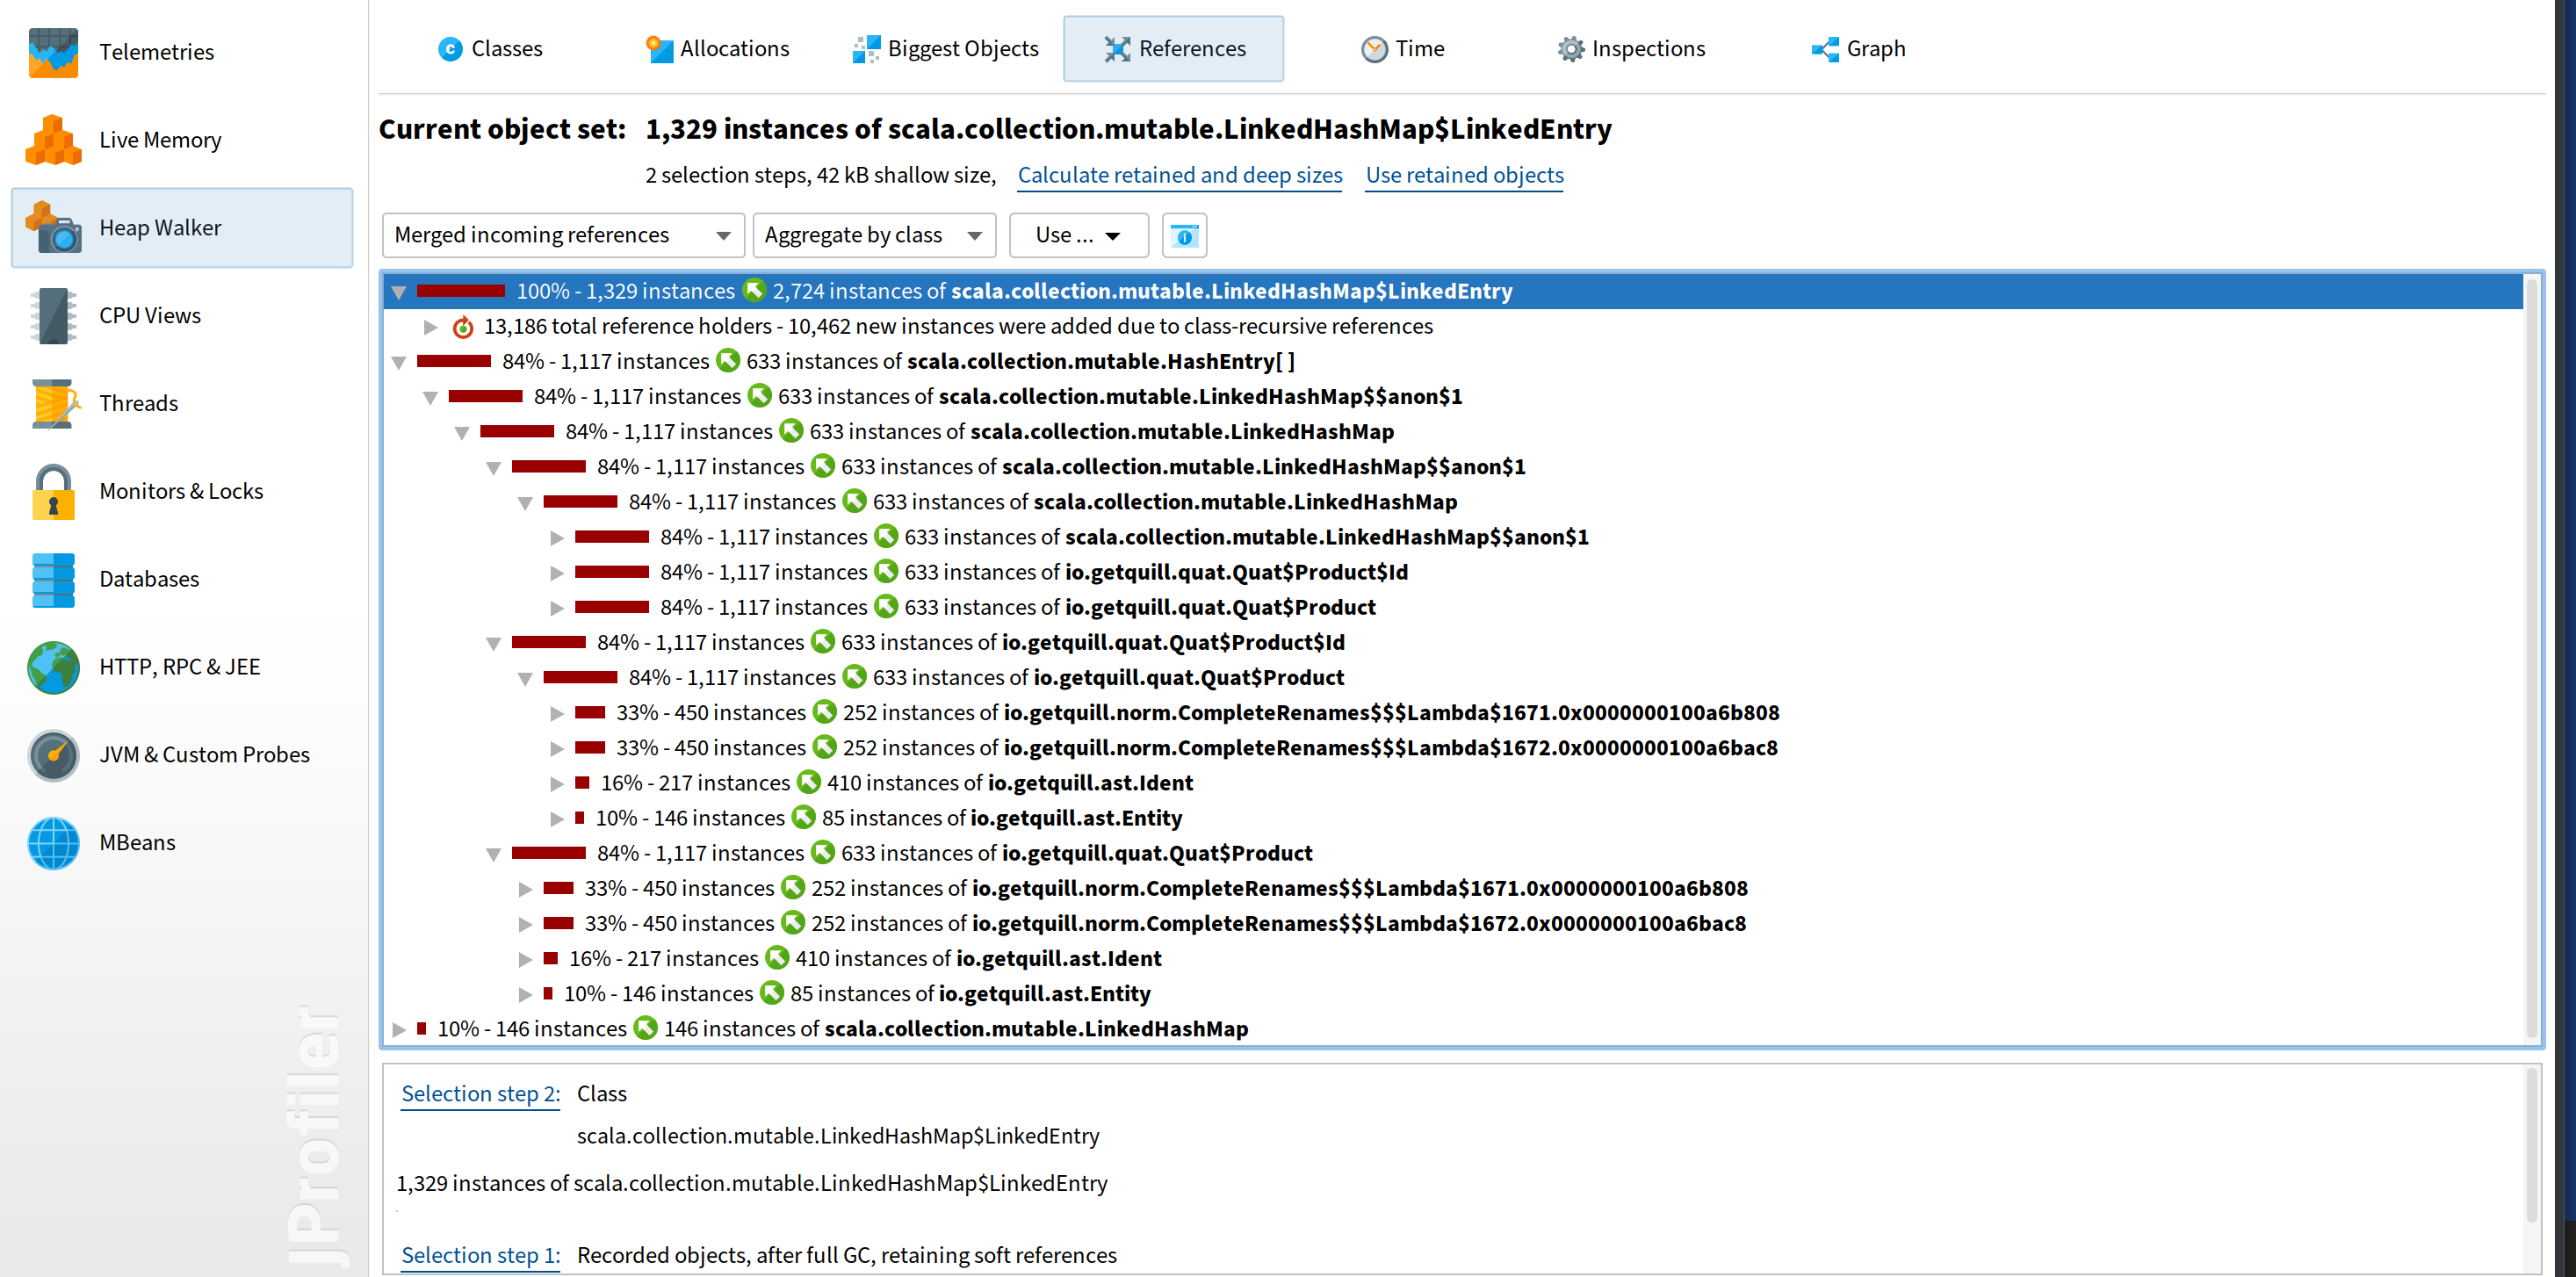
No surprise, they are basically all from quill as well. However, I couldn’t understand the internal AST representation of quill and wasn’t sure where they were coming from.
It was time to search the Internet to see if there was any known issue in quill about memory leaks. Maybe I didn’t have the right query. I didn’t find proper results from the Internet.
After struggling for a while, I went to its GitHub repo to search “Memory leak” directly and found 3 issues. That’s good! And there is one describes the exact problem we have. If we see the allocation tree above, we can find there is a call from NormalizeCaching (at the bottom of the tree in the picture), which is the class that the issue describes. I guess I didn’t go that far enough to check this class. I’m glad someone else did and found the issue! Basically the root cause is there is a map in the caching that doesn’t have any bound. So the cache triggered by dynamic queries never gets expired and keeps growing:
private val cache = new ConcurrentHashMap[Ast, Ast]
Fix the Memory Leak
The issue is pretty old and is related to a core feature. I’m surprised it’s not fixed yet. As I said, once we found the root cause, the fix should be easy. We just need a way to make the cache expire. I replaced the cache implementation with Guava’s cache, and after the suggestion of the maintainer changed it to Caffeine’s cache implementation. Here is the PR.
I built quill with the fix locally and tested with RSS Brain. The memory leak is indeed fixed! How exciting it is!
Conclusion
Let’s review the process of fixing the memory leak in this case:
- Setup profiler.
- Run full GC cannot resolve the memory issue.
- Compare the snapshots between when JVM first started and when the memory increases. See which classes increased most.
- Using allocation tree to find out which part of the code is creating the instances.
- Using references in heap walker to check which classes hold references of those instances.
- Check the identified code and classes.
- If it’s a third party library and we cannot find the root cause, check if the issue is reported. Otherwise report the issue.
- Fix the memory leak based on the root cause.